Listen to Your Customers: Leveraging Customer Experience Metrics for Maximum Impact
News, insights and updates from the team at Bloom Equity Partners
Happy Friday technology investors, operators, and enthusiasts.
We’re here again with The Bi-Weekly Bloom – one of the best resources for Private Equity, Enterprise Software, and Technology news. In each edition, we delve into:
PE Interest in Technology
Our team’s favorite articles and podcasts from last week
Insightful tweets from fellow investors and operators
Join nearly 10,000 readers for a summary of our favorite software insights, articles, podcasts, tweets, and news headlines, subscribe below:
Listen to Your Customers: Leveraging Customer Experience Metrics for Maximum Impact
In today’s competitive landscape, understanding and improving customer experience (CX) is critical to a company’s success. Companies track several key customer satisfaction metrics, including Net Promoter Score (NPS), Customer Satisfaction Score (CSAT), and Customer Effort Score (CES), to gauge performance. Each of these metrics provides unique insights, but their effectiveness depends on what you’re trying to achieve.
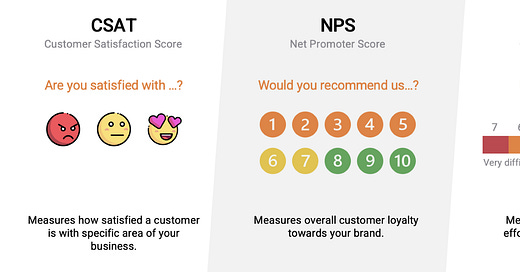
In this article, we will break down the importance of these metrics, when and why to use each metric, and how they translate into tangible financial benefits. In many cases, companies use a combination of these metrics to generate a full picture of a customer's experience. Here is a simple definition of these metrics: CES tells you where customers are struggling, CSAT highlights their immediate reactions, and NPS gives a sense of overall brand loyalty.
1. Customer Effort Score (CES): Simplify the Customer Journey
What it is: CES measures how easy or difficult it is for customers to interact with your business—whether it's resolving an issue or making a purchase.
Why use it: If your focus is reducing friction in your customer journey, CES is a powerful tool. Research shows that lowering customer effort increases loyalty, as customers tend to return to companies that make their experiences seamless. CES is especially valuable for service-heavy businesses that deal with support or onboarding, where ease of use is critical to customer retention.
How to implement it: Typically, CES is measured after a specific interaction, asking customers to rate how easy it was to accomplish their task on a scale of 1-5 or 1-7. This metric gives you direct insights into areas that may frustrate your customers and helps you make targeted improvements.
2. Customer Satisfaction Score (CSAT): The Direct Feedback Approach
What it is: CSAT is the most straightforward metric, asking customers how satisfied they are with a product, service, or specific interaction.
Why use it: CSAT is an effective way to measure short-term customer happiness. If you want a snapshot of customer satisfaction right after a transaction, CSAT provides instant feedback. It’s often used in customer support or product testing, where immediate reaction to a service or feature is key.
How to implement it: CSAT surveys are usually sent immediately after a customer interacts with your business. A simple question like “How satisfied are you with your recent experience?” with a 1-5 rating scale gives you quick, actionable feedback. However, CSAT can be limited—it only captures current satisfaction, not long-term loyalty.
3. Net Promoter Score (NPS): Predicting Long-Term Loyalty
What it is: NPS measures the likelihood that customers will recommend your company to others. It’s a loyalty-based metric, designed to predict long-term customer relationships.
Why use it: If you’re interested in tracking overall brand health and long-term loyalty, NPS is your go-to metric. It provides a clear sense of who your promoters (loyal fans) are, and who your detractors (unhappy customers) might be. While it doesn’t give detailed feedback on why customers feel a certain way, it offers a clear high-level view of customer advocacy.
How to implement it: NPS asks one key question: “How likely are you to recommend our company to a friend or colleague?” Customers respond on a scale of 0-10, and are classified into Promoters (9-10), Passives (7-8), or Detractors (0-6). The score is calculated by subtracting the percentage of Detractors from the percentage of Promoters. NPS is widely regarded for its simplicity, but it’s most effective when paired with follow-up questions to uncover the ‘why’ behind the score.
The Financial Benefits of Measuring These Metrics
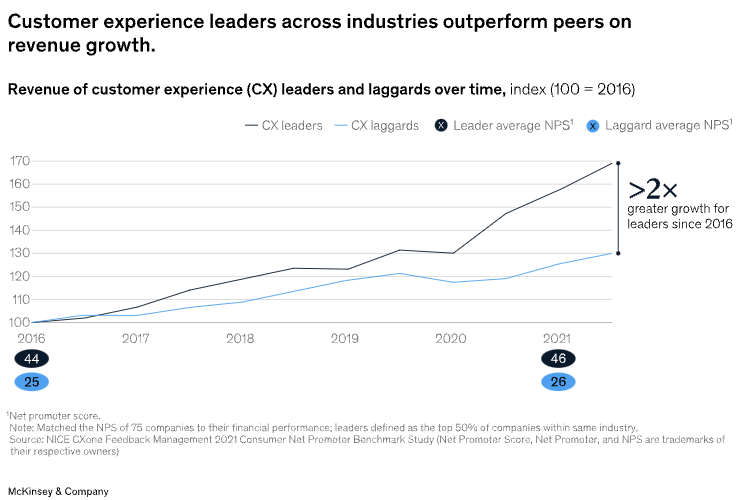
Tracking these metrics goes beyond understanding customers experiences with a company’s offering—they can directly impact financial outcomes when leveraged effectively. McKinsey's findings analyzed companies performing in the top half of financial performance in their respective industries and found that organizations with robust, experience-led strategies, achieved revenue growth rates 2-5 times higher than competitors who did not prioritize customer experience.
Here are some ways these metrics boost the bottom line:
Customer Retention and Revenue Growth from Loyalty
Improving customer experience can improve customer retention and loyalty, leading to increased profits. Higher NPS and CSAT scores indicate happier customers who are more likely to remain loyal and spend more over time. This sustained engagement and reduced churn contributes to higher profitability.
Boosted Customer Lifetime Value (CLV)
Metrics like NPS and CSAT help companies recognize and engage high-value customers, driving cross-sell and upsell opportunities. Closely linked to higher retention and loyalty, this targeted engagement enhances CLV.
Reduced Operational Costs
Focusing on metrics like CES and CSAT helps identify friction points in the customer journey. Alleviating these friction points leads to lower support interactions and a reduction in overall operating expenses.
Lower Customer Acquisition Costs
Promoters, or highly satisfied customers, often spread positive word-of-mouth, decreasing the need for costly customer acquisition efforts.
Putting it all together
David Lambert, an Experience Management Principal at Medallia, emphasizes that customer satisfaction metrics like NPS, CSAT, and CES should be tools for driving actionable change, not merely improving scores. He describes how an insurance company used NPS as a starting point to increase customer retention from 87% to 89% over three years. Instead of focusing solely on boosting the NPS score, the company analyzed customer feedback and identified 431 improvement actions based on what customers repeatedly requested. This actionable approach led to a 7% growth in their customer base, 196,000 fewer support contacts, and an incremental 3.5% increase in revenue.1
McKinsey highlights another powerful case of experience-led growth with a telecom company that transformed its approach to customer experience and saw extraordinary financial results. He started by listening to customer calls and, by the end of their efforts, customer satisfaction ratings soared from worst to first in the industry. Their strategy focused on removing pain points and enhancing service, resulting in churn rates reducing by 75% and revenue nearly doubling over three years.2
Don’t Rely on One Metric Alone
While each metric has its strengths, using them together provides a more holistic view of your customers’ experience. By aligning the right metric with your business objectives, you’ll be able to make data-driven decisions that drive growth and profitability.
References
1 "How Useful Are NPS, CES, and CSAT Scores in Measuring CX Success?" CX Focus.
2 "Experience-Led Growth: A New Way to Create Value." McKinsey & Company.
About Bloom Equity Partners
We’re big fans of mission-critical enterprise software, technology and tech-enabled business service companies with a competitive moat and a loyal, diversified, and growing customer base. Whether the business is bootstrapped, VC-backed, or a division of a larger organization, Bloom is completely agnostic to the structure. We are actively seeking investment opportunities that fall within the criteria below. We welcome the opportunity to discuss potential investments with founders, operating executives and intermediaries.
Our Investment Criteria
Industry: B2B Software and Technology-Enabled Companies
Geography: North America, Europe, Australia and New Zealand
Revenue: $5M - $50M
Growth: No requirement
Profitability: Negative - $10M EBITDA
Investment Type: Operational control required
If you or someone you know is considering selling or investing in their business, we would love to learn more! Check out our referral partner program, which compensates referrers for introductions that lead to affirmative outcomes.
What We’re Reading and Listening To…
The Next Chapter for Vertical Software
Favorites from the Ecosystem
Investors…
Operators…
Founders…
If you’re enjoying The Bi-Weekly Bloom, we’d appreciate it if you shared it with your network.


